When measuring the concentration of various aqueous solutions such as water-soluble cutting fluid, cleaning solution, corrosion inhibitor, hydraulic fluid, ethyl alcohol, hydrogen peroxide solution, glycerin, antifreeze, and sodium hydroxide using a refractometer (Brix meter), a conversion graph comparing Brix (refractive index) and concentration is prepared in advance.
① In order to create the conversion graph, water-soluble cutting fluid solutions with a concentration of 5.0%, 10.0%, and 15.0% are mixed.
Confirm in advance whether the concentration unit is g/100g, g/100mL, or mL/100mL.
* Make sure that the solutions are diluted accurately.
For g/100g (weight percentage), a concentration of 10.0% would be a mixture of 10.0 g of undiluted cutting fluid and 90.0 g of water measured with a scale.
For mL/100mL (volume percentage), a concentration of 10.0% would be a mixture of 10.0 mL of undiluted cutting fluid and 90.0 mL of water measured with a graduated cylinder.
Either 100 g or 100 mL of the sample is created.
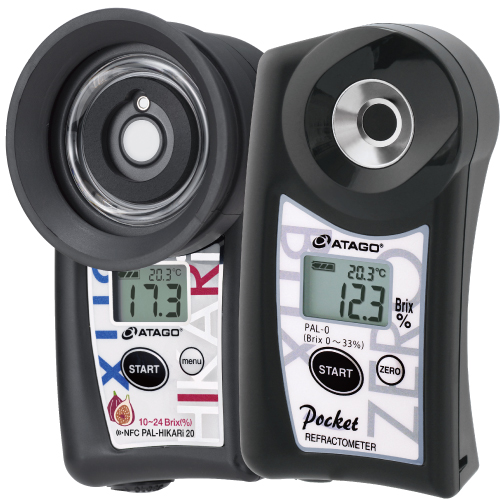
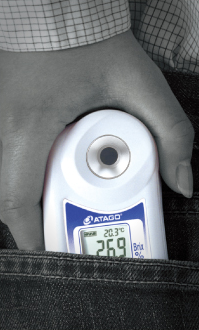
② Calibrate the refractometer.
③ Measure the each of the 5.0%, 10.0%, and 15.0% solutions and read the refractiveindex or Brix, whichever is required.
④ An example of possible measurement data can be found below (Table 1).
| Solution Concentration | Refractometer reading (Brix) |
|---|---|
| Water (0.0%) | 0.0% |
| 5.0% | 3.5% |
| 10.0% | 7.1% |
| 15.0% | 10.5% |
The following graph can be made using this data.
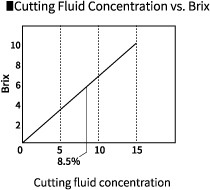
After this, unknown concentration percentages can be calculated using the measurements (Brix) from a refractometer.
For example, if the measurement from the refractometer is a Brix of 6.0%, the conversion graph found above can be used to find the concentration, which would be 8.5%.
Besides "Refractive Index (Brix) vs. Concentration," other graphs can be created using a similar method, such as "Refractive Index (Brix) vs. Specific Gravity" for aqueous solutions, "Refractive Index (Brix) vs. Mixture Ratio of 2 Fluids" for petroleum fluids, or "Refractive Index (Brix) vs. Contamination Concentration" for when machining oil or flux has dissolved into cleaning solution. When the refractive index is affected greatly by temperature, such as with organic and petroleum fluids, it is normally measured at a constant temperature of 20°C or 25°C with an Abbe refractometer connected to a circulating water bath at a constant temperature or an RX-5000α, which has an internal Peltier device. Therefore, the conversion graph would be created using values measured at a constant temperature.
* The values in Table 1 can be made into a graph using a spreadsheet tool, and an equation can be created from the formatting of the approximated curve, allowing the creation of a more detailed conversion table.
* When using a Brix meter (refractometer) on-site, even if a graph like the one above is not drawn, by recording the range of concentrations of cutting fluid measured by the Brix meter (refractometer), the acceptable range can become familiar to anyone. For example, it might be acceptable as long as the measurements from the Brix meter (refractometer) are between 3.0% and 5.0%. The acceptable range can even be posted in large font on-site.